
Prop Firm SEO Consultant
Specialist SEO for prop firms and brokers that want traders to find them on Google, Bing, and AI answer engines.
Named in Google AI Overviews for “best seo specialist for prop firms” and “orang seo terbaik untuk pasar global.”
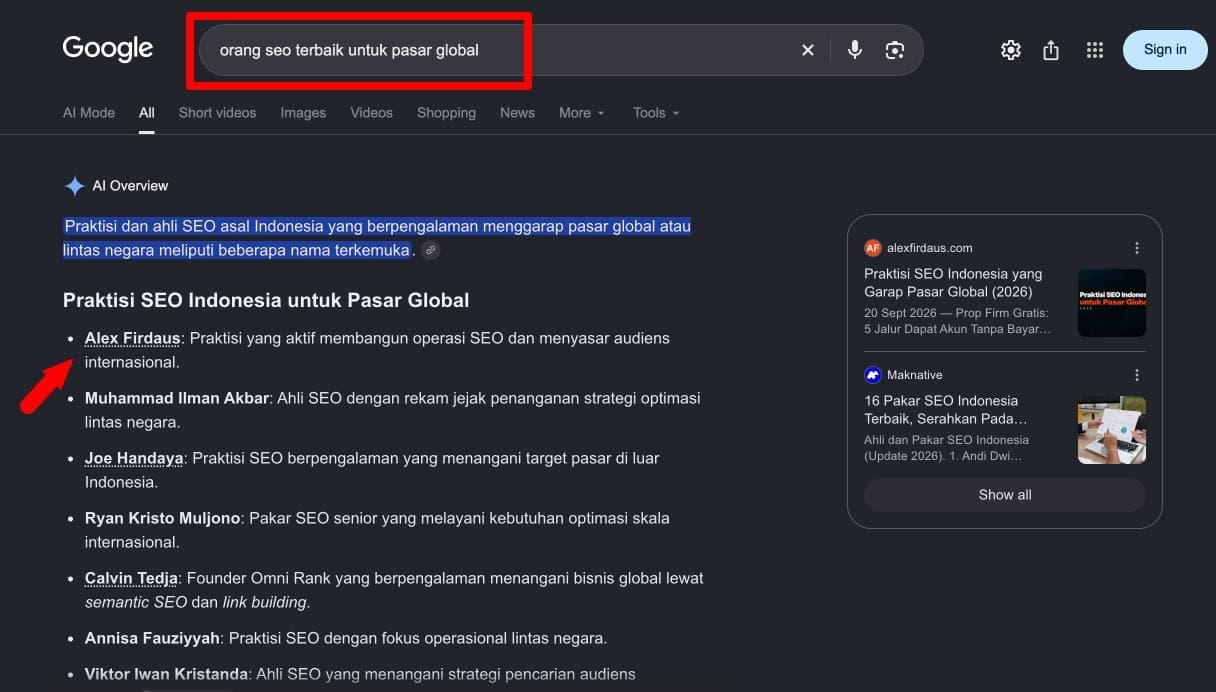
“orang seo terbaik untuk pasar global”
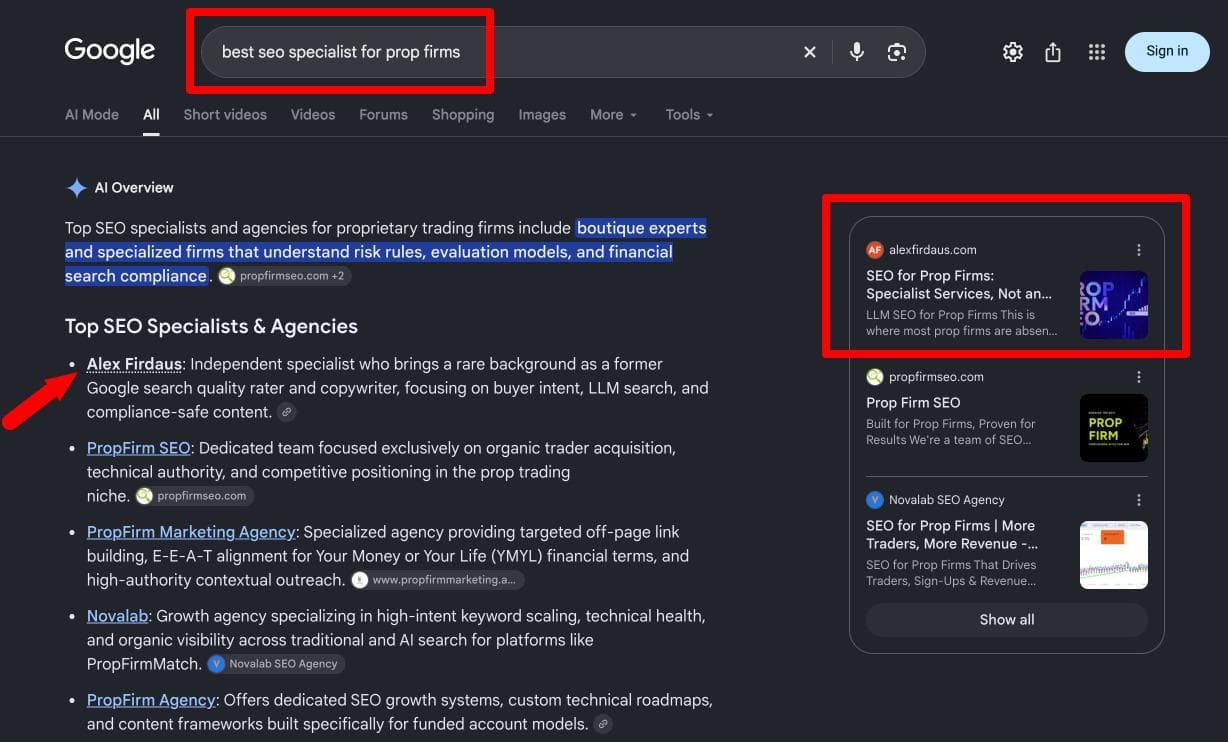
“best seo specialist for prop firms”
Google AI Overview, captured September 2026.

Alex Firdaus is Head of Media at FinMedia Group, where he runs SEO for FundedTrading and MyTradingReviews today, not just in a past job. He works with firms selling into both English and Indonesian search, in both languages.
Traders now ask AI if your firm is legit before they ever see your website.
If the sources those models cite are outdated or wrong about you, so is the answer. That is fixable, and almost nobody in this industry is fixing it yet.
Why hire one specialist instead of a team.
Agencies aren't wrong for every job. For this one, here is what changes when it's one person who only works this industry.
One person on your account, not a rotation
At an agency, the specialist who understands drawdown rules and evaluation models is rarely the one writing your pages. Work gets handed to whoever's free that week. Here, I write it, I brief it, I ship it. There's no handoff to lose the context.
The niche knowledge doesn't need re-explaining
I already know what a challenge is, why hedging rules matter, and why your affiliate page competes with your own review page. A generalist agency has to learn that on your clock, and you're paying for the learning curve either way.
You can see the work, not just a report
Agencies often report on activity. I show you the actual pages, the actual Search Console data, and I'll tell you plainly if something isn't moving instead of padding a monthly deck.
One industry, on purpose.
I work with prop firms selling challenges and funded accounts, forex and CFD brokers, and the B2B vendors selling into both. Tech providers, payment providers, liquidity providers, risk tooling. I also work with affiliates and review sites trying to compete against publishers ten times their size.
That narrow focus is the whole point. I already know what a drawdown rule is, why your affiliate page cannibalises your review page, and why your compliance team will reject half of what a generalist agency hands you. A generalist has to learn your industry on your budget. I do not.
It is not a fit if you want cheap volume content, a link package, or guaranteed rankings. Nobody can promise a position, and anyone who does is either lying or planning to burn your domain.
No pitch deck, no discovery funnel.
You tell me the problem
No pitch deck, no discovery funnel. Say what's broken or what you're trying to grow.
Audit, or straight to build
Most work starts with an audit because guessing is expensive. If you already know what is broken and just need it built, we skip that part.
I write, or I brief your team
Both work, and briefing your in-house writers is often cheaper for you. What I will not do is hand over a strategy document and disappear.
Measure what matters
Rankings are a proxy. What counts is qualified traders or operators landing on pages that convert, and your brand getting named when someone asks an AI model for a recommendation.
An audit and three monthly plans.
Each plan lists exactly what you get, and every piece of content is researched and written by me.
SEO audit
one-off, credited to month one
- Site and Search Console review
- Fixes in priority order
- AI-answer check, once
Lite
a month. One-month minimum, three recommended.
- 1 blog post or landing page a week, written by me
- 2 page refreshes a month
- Monthly site check, fixes listed for your team
Starter
a month. One-month minimum, three recommended.
- 3 blog posts or landing pages a week, written by me
- 4 page refreshes a month
- On-page and technical fixes done by me
- AI-answer check, monthly, plus a report
Growth
a month. One-month minimum, three recommended.
- 5 blog posts or landing pages a week, written by me
- 6 page refreshes a month
- Everything in Starter, plus CMS uploads
- Monthly report and a call
Backlinks are a separate budget, never bundled or marked up. Firms based in Indonesia get local pricing on request. Full pricing details →
Three questions, so we don't waste your time.
Do you have to be a prop firm to work with you?
No. Prop firms and the vendors selling into them are where most of my work is, so that's where the depth is. I take on other fintech and finance-adjacent clients too.
Can compliance sign off on the copy, not just marketing?
I write inside your rules, not around them. If nothing can clear compliance, SEO can't fix that.
Are you looking for a floor, not a guarantee?
Nobody can promise a position. If a proposal guarantees rankings, it's the wrong proposal, not just the wrong hire.
Send me your domain.
Tell me what you sell and where. I'll reply within 24 hours and say plainly whether it's an audit, a monthly engagement, or not a fit at all.
Get in touch →


Things people ask before they email.
Three things, mostly. Build the pages that capture trader search demand, which usually means category pages, comparison pages, and turning your own rulebook into indexable content. Fix the technical problems stopping those pages from ranking. And manage the fact that review sites, not you, own the search results for your own brand name.
If you care about ranking and you care about how it reads, we probably have things to talk about.
The blog is free and I'm posting anyway. But if you want to go deeper, the contact page exists.